a legacy enterprise, in a compose file
HELIOS modernizes four "legacy" sources - a SOAP OrderManagement service, nightly CSV drops, a flaky REST API and a busy OLTP database - into a governed dimensional warehouse: Debezium CDC, Airflow orchestration, dbt transformations, Great Expectations quality gates with dead-letter quarantine, Marquez lineage, Prometheus/Grafana. Personal project, complete: every number below is reproducible with a make target.
see it run - real captures from the live stack
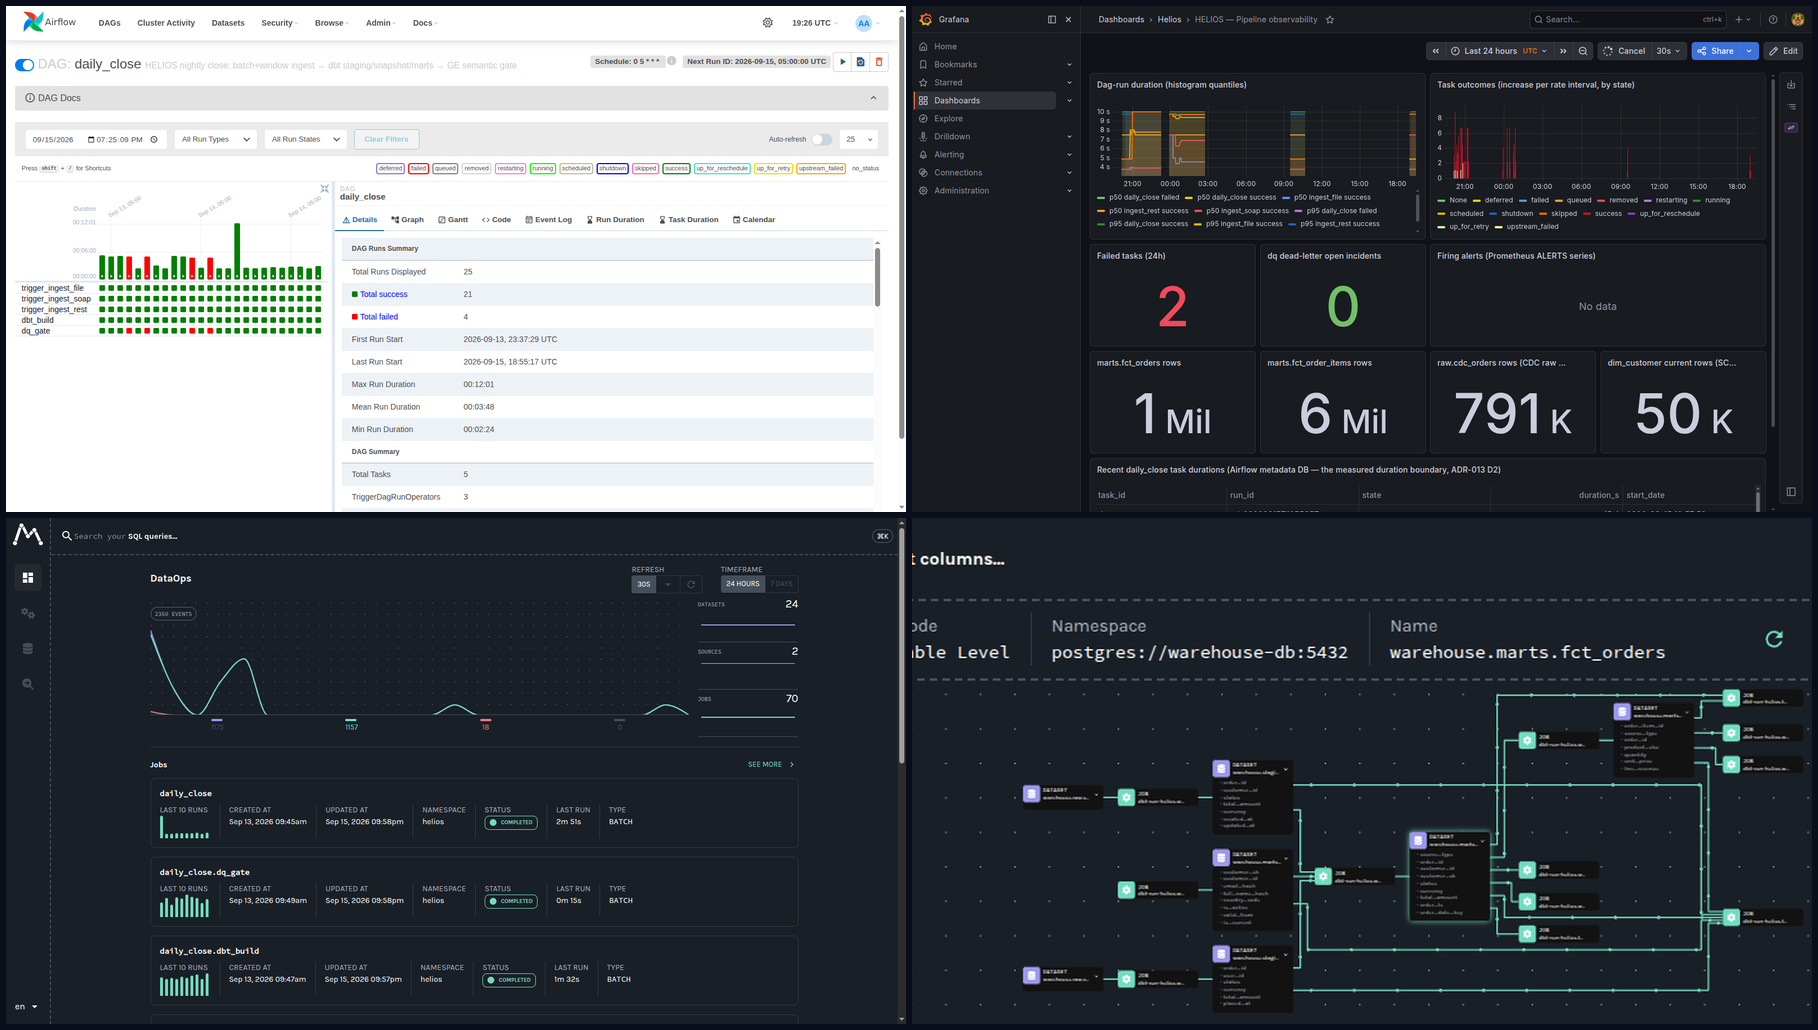
The four tiles in the banner above are the actual UIs serving data the pipeline actually processed. Below, each one full-size. Nothing here is mocked; the counters line up with the measured bench bands in the repo's README.
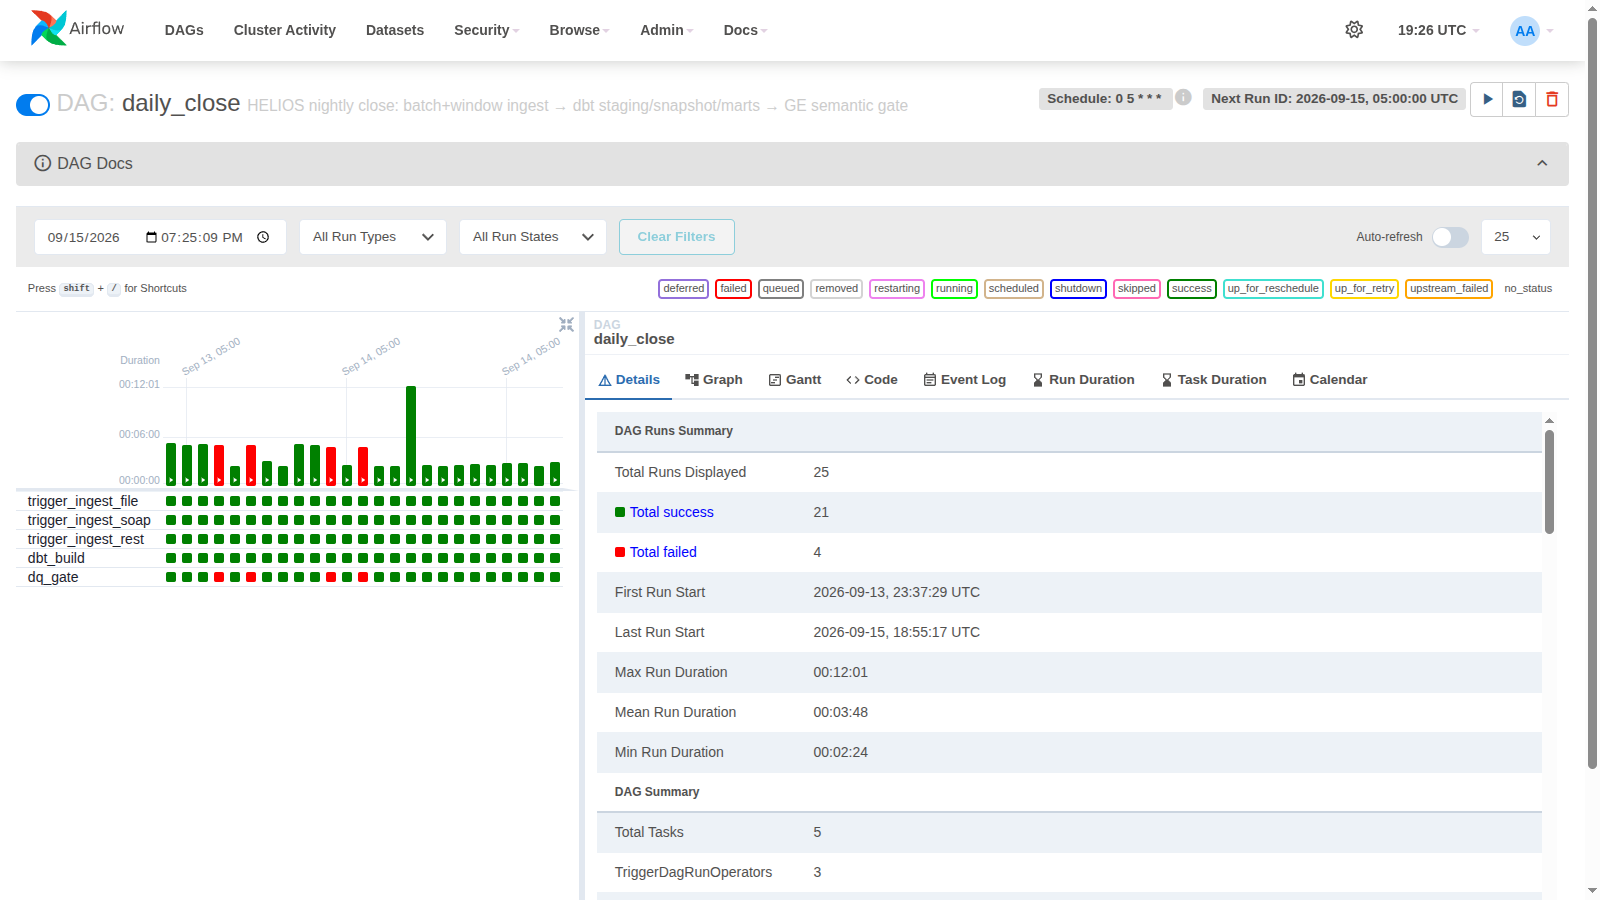
Airflow - the nightly close. 25 runs of daily_close (schedule 05:00 UTC, five tasks per run: three parallel ingest triggers, the dbt build, the Great Expectations gate). The red squares are real history: terminal gate failures from the chaos drills, each one recovered and converged - the resilience story is visible in the run history, not just claimed.
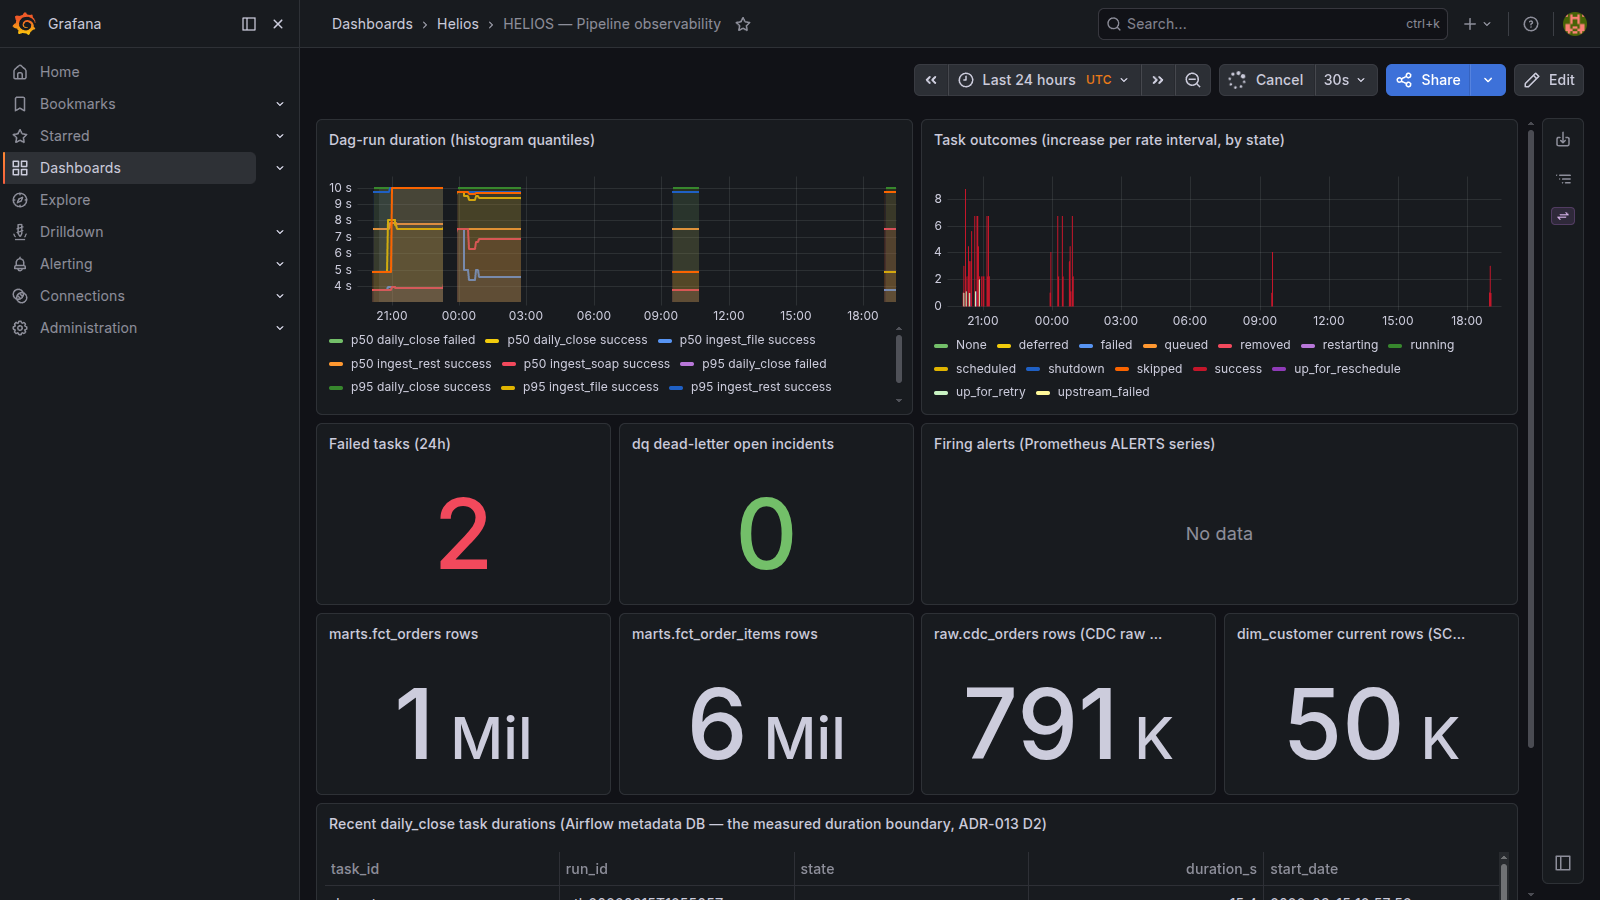
Grafana - pipeline observability. Dag-run duration quantiles, task outcomes by state, dead-letter incidents at 0, and live row counts pulled read-only from the warehouse: fct_orders ~1M rows, fct_order_items ~6M, raw CDC ~791k, dim_customer 50k with SCD2 history.
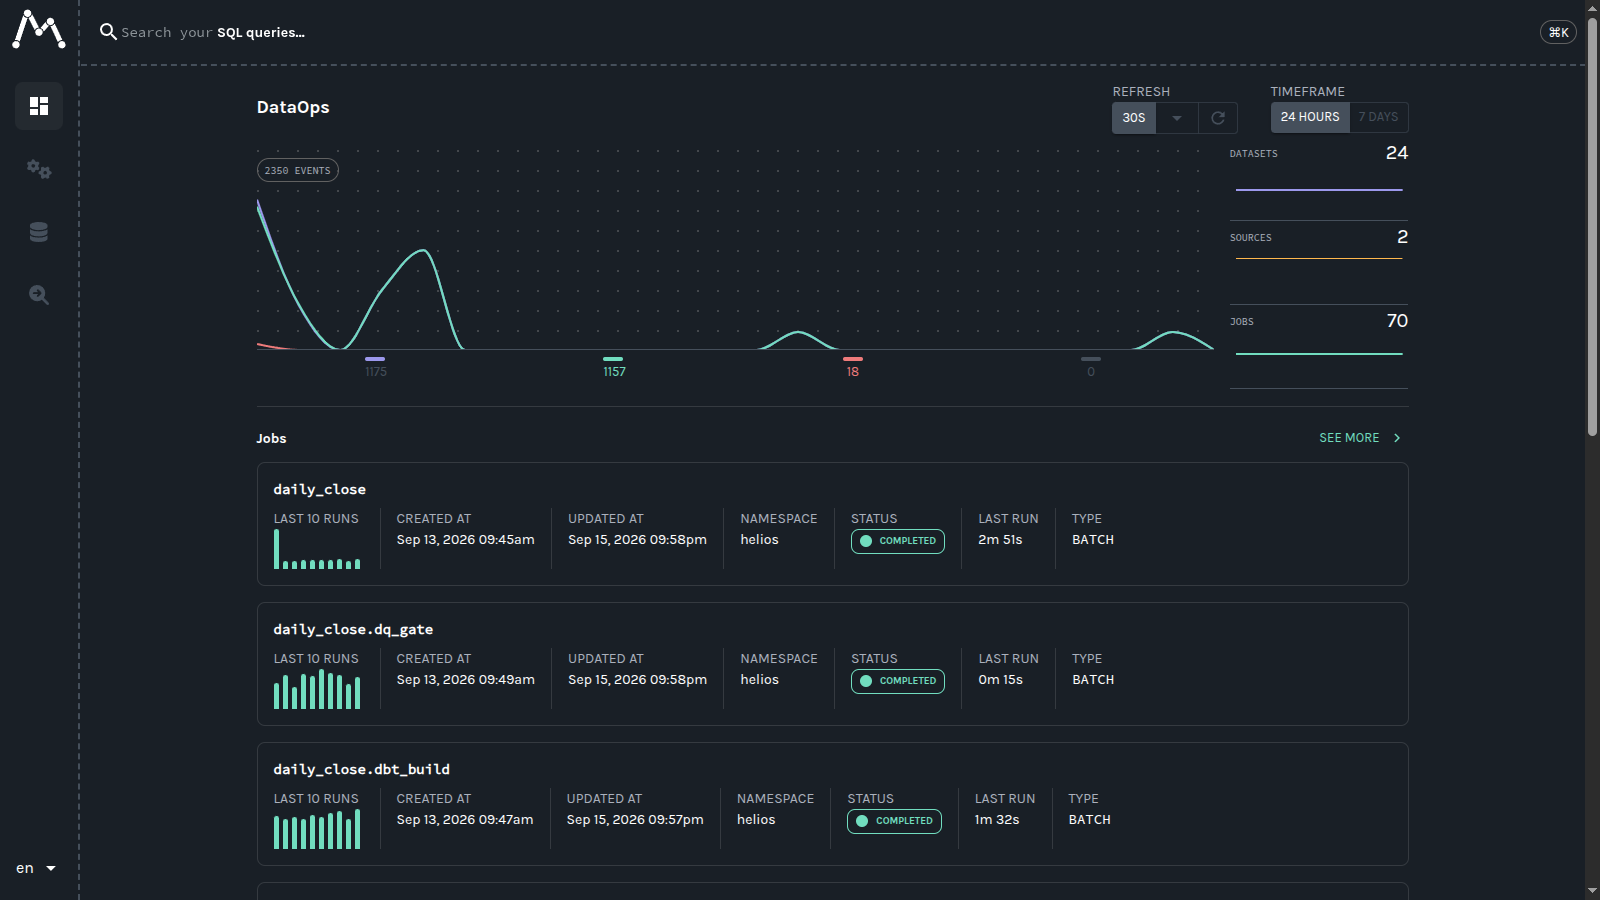
Marquez - the job census. 24 datasets, 70 jobs, 2,350 lineage events in 24 hours. The nightly close and its tasks all COMPLETED, with real durations (2m51s / 1m32s / 0m15s).
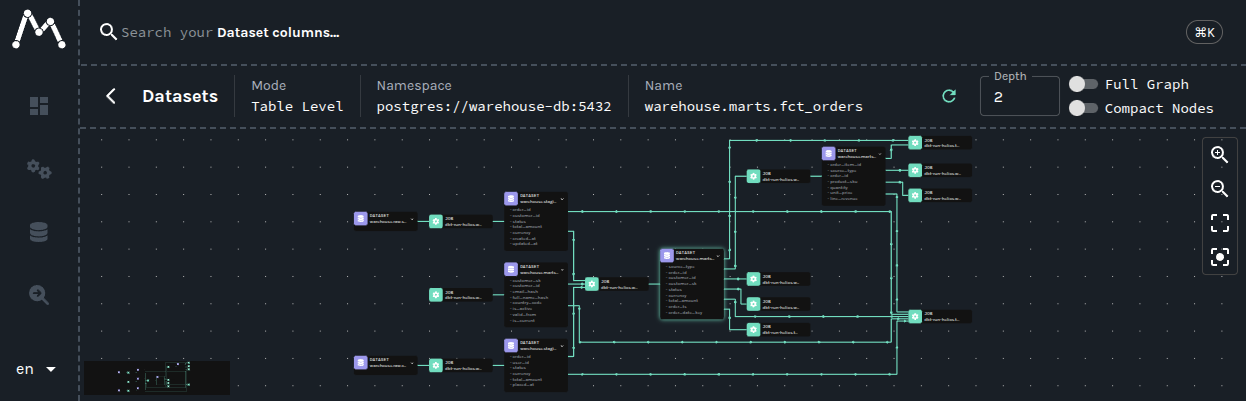
Marquez - lineage into the fact table. Table-level graph for warehouse.marts.fct_orders: raw sources, the staging models, the SCD2 snapshot, the published fact - with a column-level view one click away.
scoreboard (all measured, evidence in the repo)
| metric | value |
|---|---|
| tests | 195 pytest · 144 dbt data tests · 32 dq unit tests, all green |
| smoke gate | stage 1: 26/26 checks + stage 2: full E2E close, exit 0 - 17 containers healthy |
| bench (3 passes) | full load 14.1M rows in 65-82 s (172k-217k rows/s); SOAP re-read 382,179 @ 2,637-2,773 rows/s; CDC applied 7.4-7.7 events/s |
| chaos | 7/7 destructive scenarios, measured recovery + convergence proofs (suite wall 3,204 s) |
| ADRs | 17 (adr-000 ... adr-016) - every decision has an alternatives table |
| verification | make smoke-test · make docs-verify · 195 pytest · 144 dbt tests · 32 dq tests - all green at close |
run it yourself
The full stack runs on one machine with Docker and make. This page is a static tour; the pipeline itself is the repo.
git clone https://github.com/xenoaitham/helios.git
cd helios
make up          # 17 containers, wait-gated on health (first run seeds the sources;
                 #  fresh volume: non-zero on cdc-sink by design until the one-time CDC bootstrap)
make cdc-setup && docker compose restart cdc-sink   # that one-time bootstrap, then `make up` again
make smoke-test  # green end-to-end: 26 infra checks + a real orchestrated close
make run-etl     # trigger the full pipeline and watch it
make docs-verify # the docs honesty sweep: targets, paths, evidence, no unverifiable numbers
dig deeper
the repo · readme · screenshots · ADRs · runbook